Math Intuition
In every quantitative endeavour, one question matters most: what is the estimand? The estimand is the precise quantity we use data to draw inference about. Too often the estimand is not defined before leaping straight to describing data and methods. This renders it impossible to assess the appropriateness of those data and methods.
Mathematics
Updated mental models
Numbers aren’t just a count; a better viewpoint is a position on a line. This position can be negative (\(-1\)), between other numbers (\(\sqrt{2}\)), or in another dimension (\(i\)).
Arithmetic became a general way to transform a number. Addition is sliding along the number line (\(+ 3\) means slide 3 to the right) and multiplication is scaling ( \(\times 3\) means scale it up 3 times).
Mathematically, the exponent function does this:
\[ \mathrm{original} \times \mathrm{growth}^{\mathrm{duration}} = \mathrm{new} \]
or
\[ \mathrm{growth}^{\mathrm{duration}} = \frac{\mathrm{new}}{\mathrm{original}} \]
| Operation | Old concept | New concept |
|---|---|---|
| Addition | Repeated counting | Sliding |
| Multiplication | Repeated addition | Scaling |
| Exponents | Repeated multiplication | Growth for amount of time |
Understanding \(e\) (it’s about growth)
The number \(e\) is the base amount of growth shared by all continually growing processes. The number \(e\) merges Rate and Time. When we write:
\[ e^x \]
The variable \(x\) is actually a combination of rate and time.
\[ x = \text{rate} \times \text{time} \]
So, our general formula becomes:
\[ \text{growth} = e^x = e^{r t} \]
The number \(e\) is about continuous growth. Intuitively, \(e^x\) means:
- How much growth do I get after after \(x\) units of time (and 100% continuous growth)
100% continuous growth means that, at any given time, the rate of change is always equal to our current value. Or more mathy: (d/dx)*(e^x) = e^x
Understanding \(ln()\) (it’s about time)
- \(e^x\) lets us plug in time and get growth.
- \(ln(x)\) lets us plug in growth and get the time it would take.
Statistics
- Probability is starting with an animal, and figuring out what footprints it will make.
- Statistics is seeing a footprint, and guessing the animal.
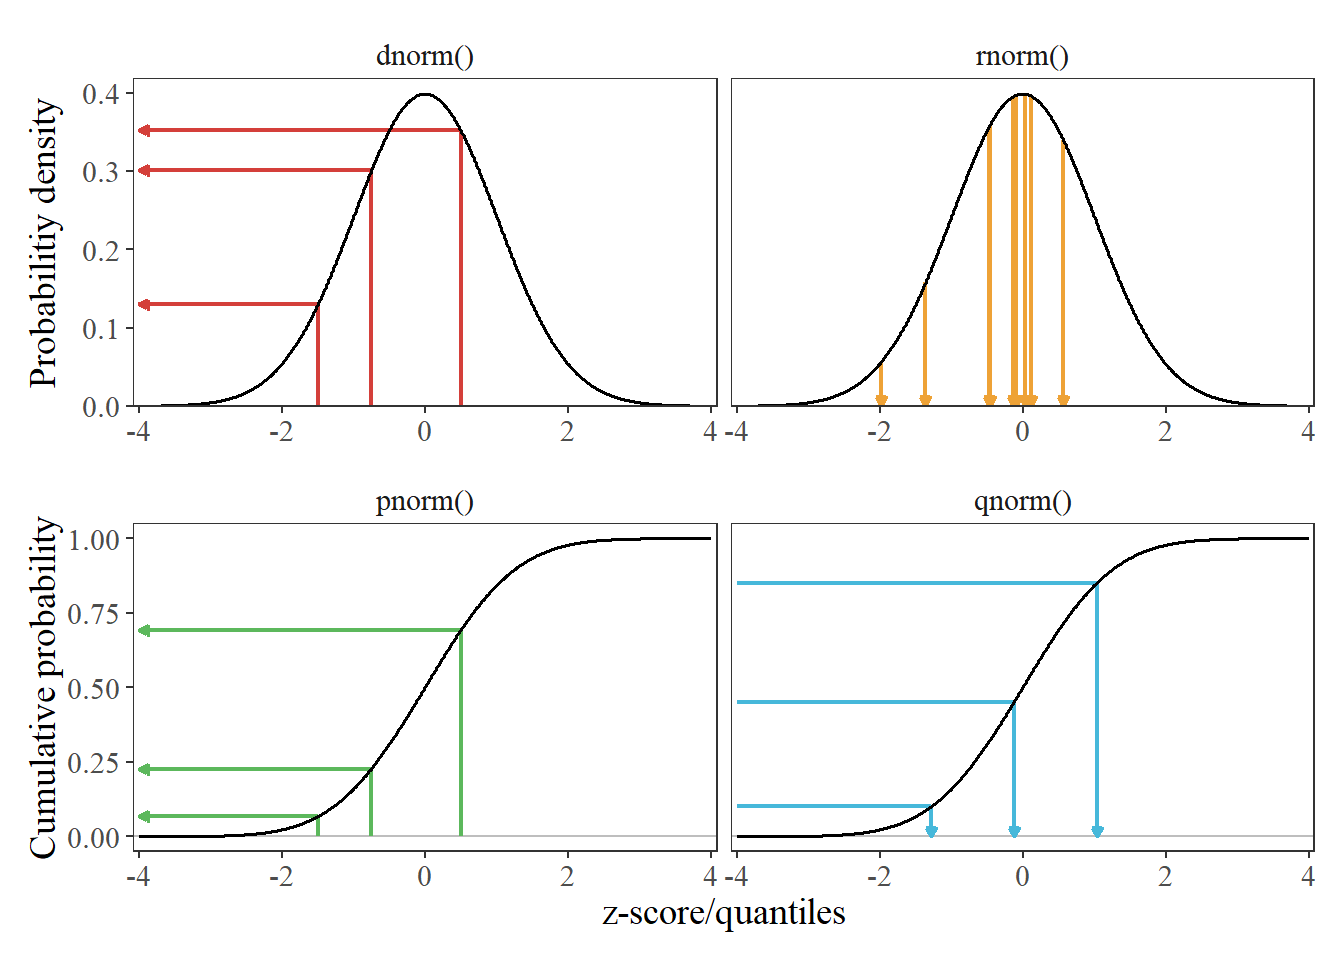
Law of Large Numbers (LLN): More data = More accurate estimate.
- Weak LLN: Convergence in probability
- Strong LLN: Convergence almost surely
Frequentist vs Bayesian statistics
- In frequentist (e.g., maximum likelihood), one does not consider prior info, and lets the “data speak for itself” (makes sense with rich data, and/or no prior beliefs).
- In Bayesian, one considers prior data in the estimation, which is helpful when you have sparse data and/or strong prior beliefs.
MLE and Bayesian estimates converge with large/rich samples or weak (or even uninformative/“flat”) priors, and diverge with strong/informative priors or little/sparse data. They will be equal iff having an infinite amount of data (priors won’t matter then).
The Bayesian analog to a confidence interval is a credible interval.
Models
“Model” here is a way of saying “set of assumptions about the data generating procedure.” So saying that some equation is a “model” is the same as saying that we think this is where the data came from. We can “turn the crank” that is, generate data through the process that’s specified in those equations, such as by pulling numbers from a normal distribution with mean and standard deviation In essence, we’re committing to the idea that this process will give us data that are substantively similar to the ones we have already.
Regression
Conventionally, regression models are written with \(\beta\) symbols for all parameters, and \(\epsilon\) for error terms. In NONMEM these would be \(\theta\) and \(\eta\).
\(Y_i\) would be DV in NONMEM. \(X_i\) would be the independent variables which is always TIME, but also any covariates.
\[ Y_i = \beta_0 + \beta_1 X_i + \epsilon_i \]
\(\beta_0 + \beta_1 X_i\) is called the linear predictor, and it describes the expected value of the outcome. \(\beta_0\) and \(\beta_1\) are called regression coefficients.
Generalized linear model
- Logistic regression
Mixed-effects/hierarchical models
Repeated measures.
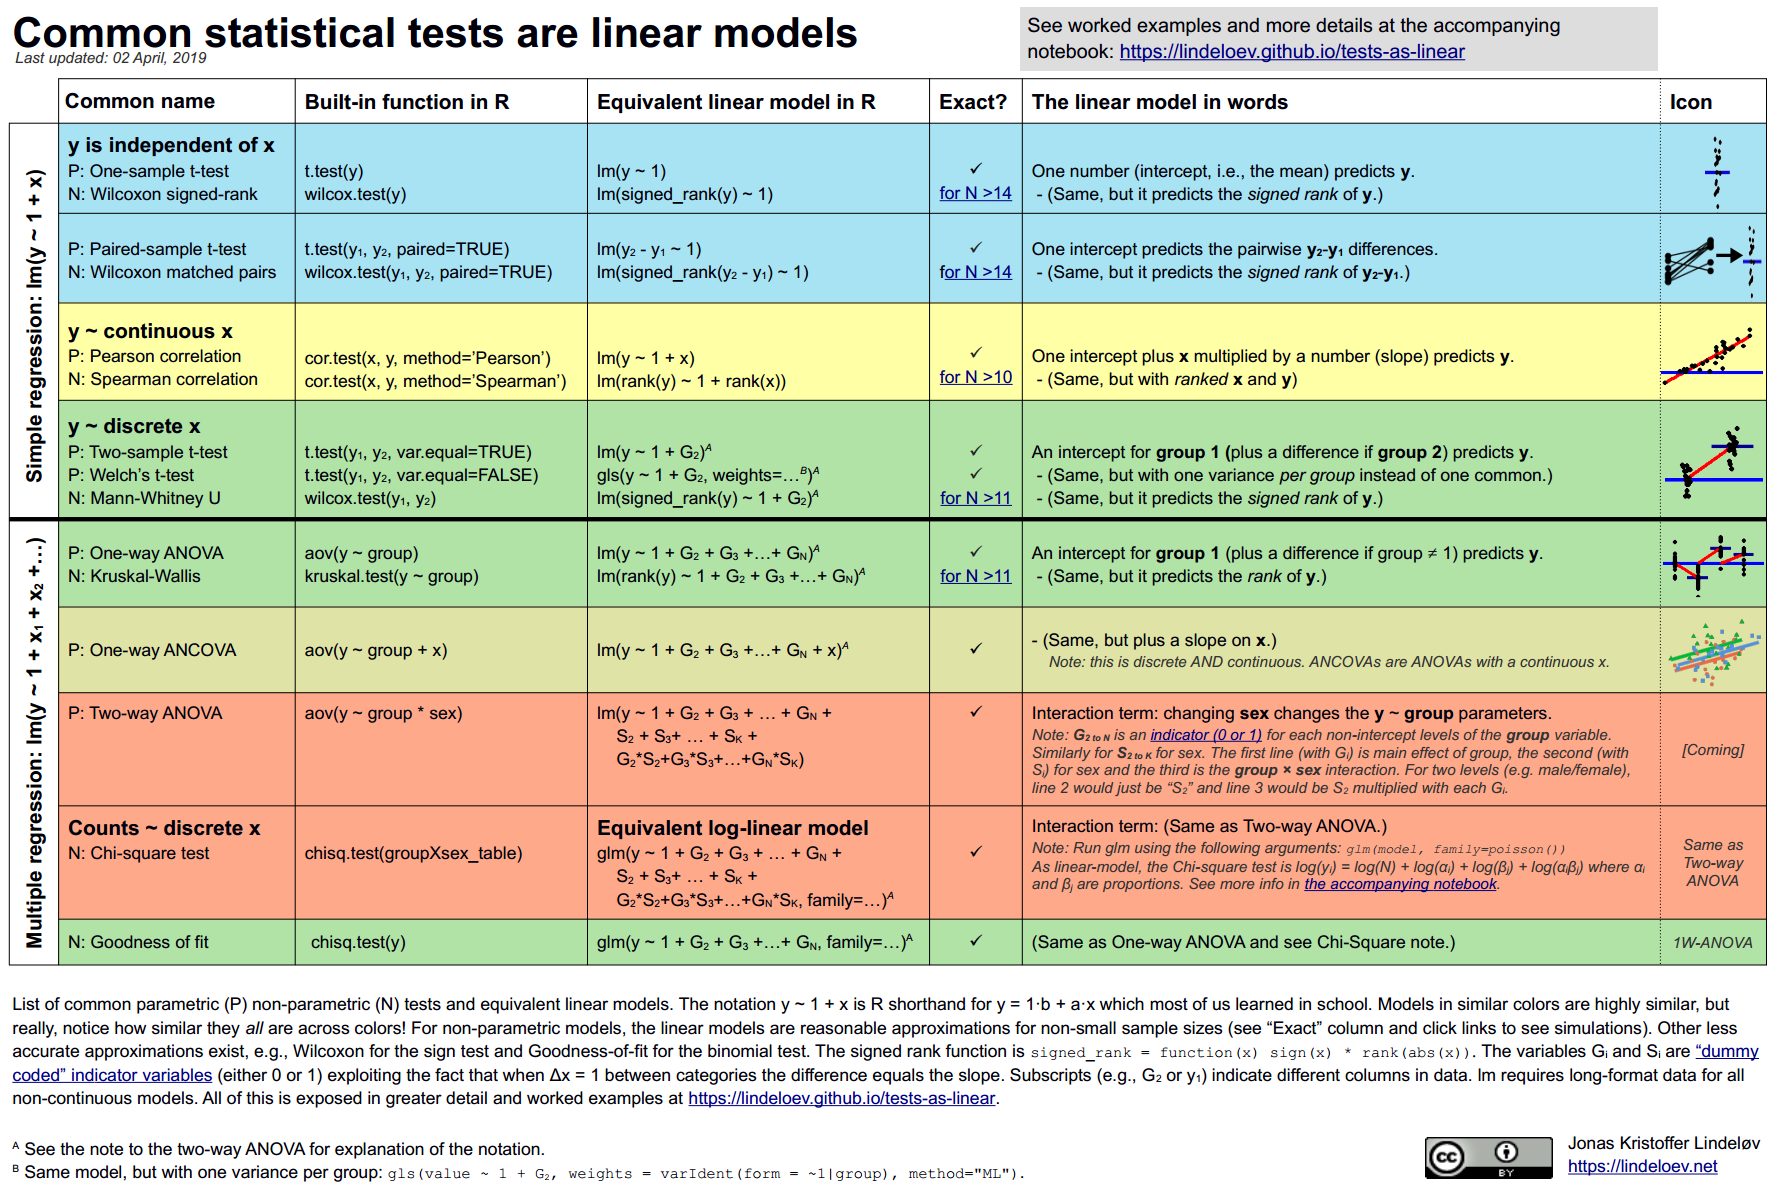
Common statistical tests are linear models
“Unfortunately, stats intro courses are usually taught as if each test is an independent tool, needlessly making life more complicated for students and teachers alike.”